As someone who works with data daily, have you ever wondered what insights you could gain if you collected and analyzed your own life data? In today’s age, everything is being recorded: your search history, your music, your groceries, even your location. Imagine if we could find an optimum path for our commute, uncover different hidden personas within our lives, or simply just find out where all the time goes.
This is my attempt to uncover some of that, starting with browser history.
Objective
Like any other analysis, we need to state the objective first. Personally, I want to know where I spend my time.
I have a goal to dedicate one hour each night (around 9 PM - 10 PM) to learning and improving my skills. However, lately, I feel like I haven’t been leveraging that time slot effectively. So, I wonder how much time I’ve been spending on entertainment.
Data
Data collection is quite straightforward. Since I use Firefox, my browse history is stored in a SQLite file named places.sqlite. Its location depends on your browser configuration, but you can refer to this documentation to find it.
Once located, first copy the file to a new directory. Then, we can use the sqlite3 command-line tool to inspect the data.
sqlite3 places.sqlite
.table
The .table command will display the available tables. While there are many, for this analysis, we will focus on two: moz_places, which describes the URL, and moz_historyvisits, which records the time of visits.
I used the following SQL query to generate the necessary data:
SELECT
    moz_places.url,
    moz_places.title,
    datetime(datetime(moz_historyvisits.visit_date/1000000, 'unixepoch'), '+7 hour') as visit_time
FROM moz_places
JOIN moz_historyvisits ON moz_places.id = moz_historyvisits.place_id
WHERE datetime(moz_historyvisits.visit_date/1000000, 'unixepoch') >= date('2024-01-01') -- convert to actual date from epoch
    and datetime(moz_historyvisits.visit_date/1000000, 'unixepoch') < date('2025-01-01')
ORDER BY visit_time ASC
Or you could use python to read it as a pandas dataframe.
import sqlite3
import pandas as pd
import datetime

with sqlite3.connect('data/places.sqlite') as con:
    cursor = con.cursor()
    query = "SELECT moz_places.url, moz_places.title, visit_time ..."
    df = pd.read_sql(query, con, parse_dates=['visit_time'])
Once data is ready, we could start do the exploration.
Exploration
The first thing I want to look at is the distribution of my activity per hour. I just need to aggregate by the hour and count the number of activities.
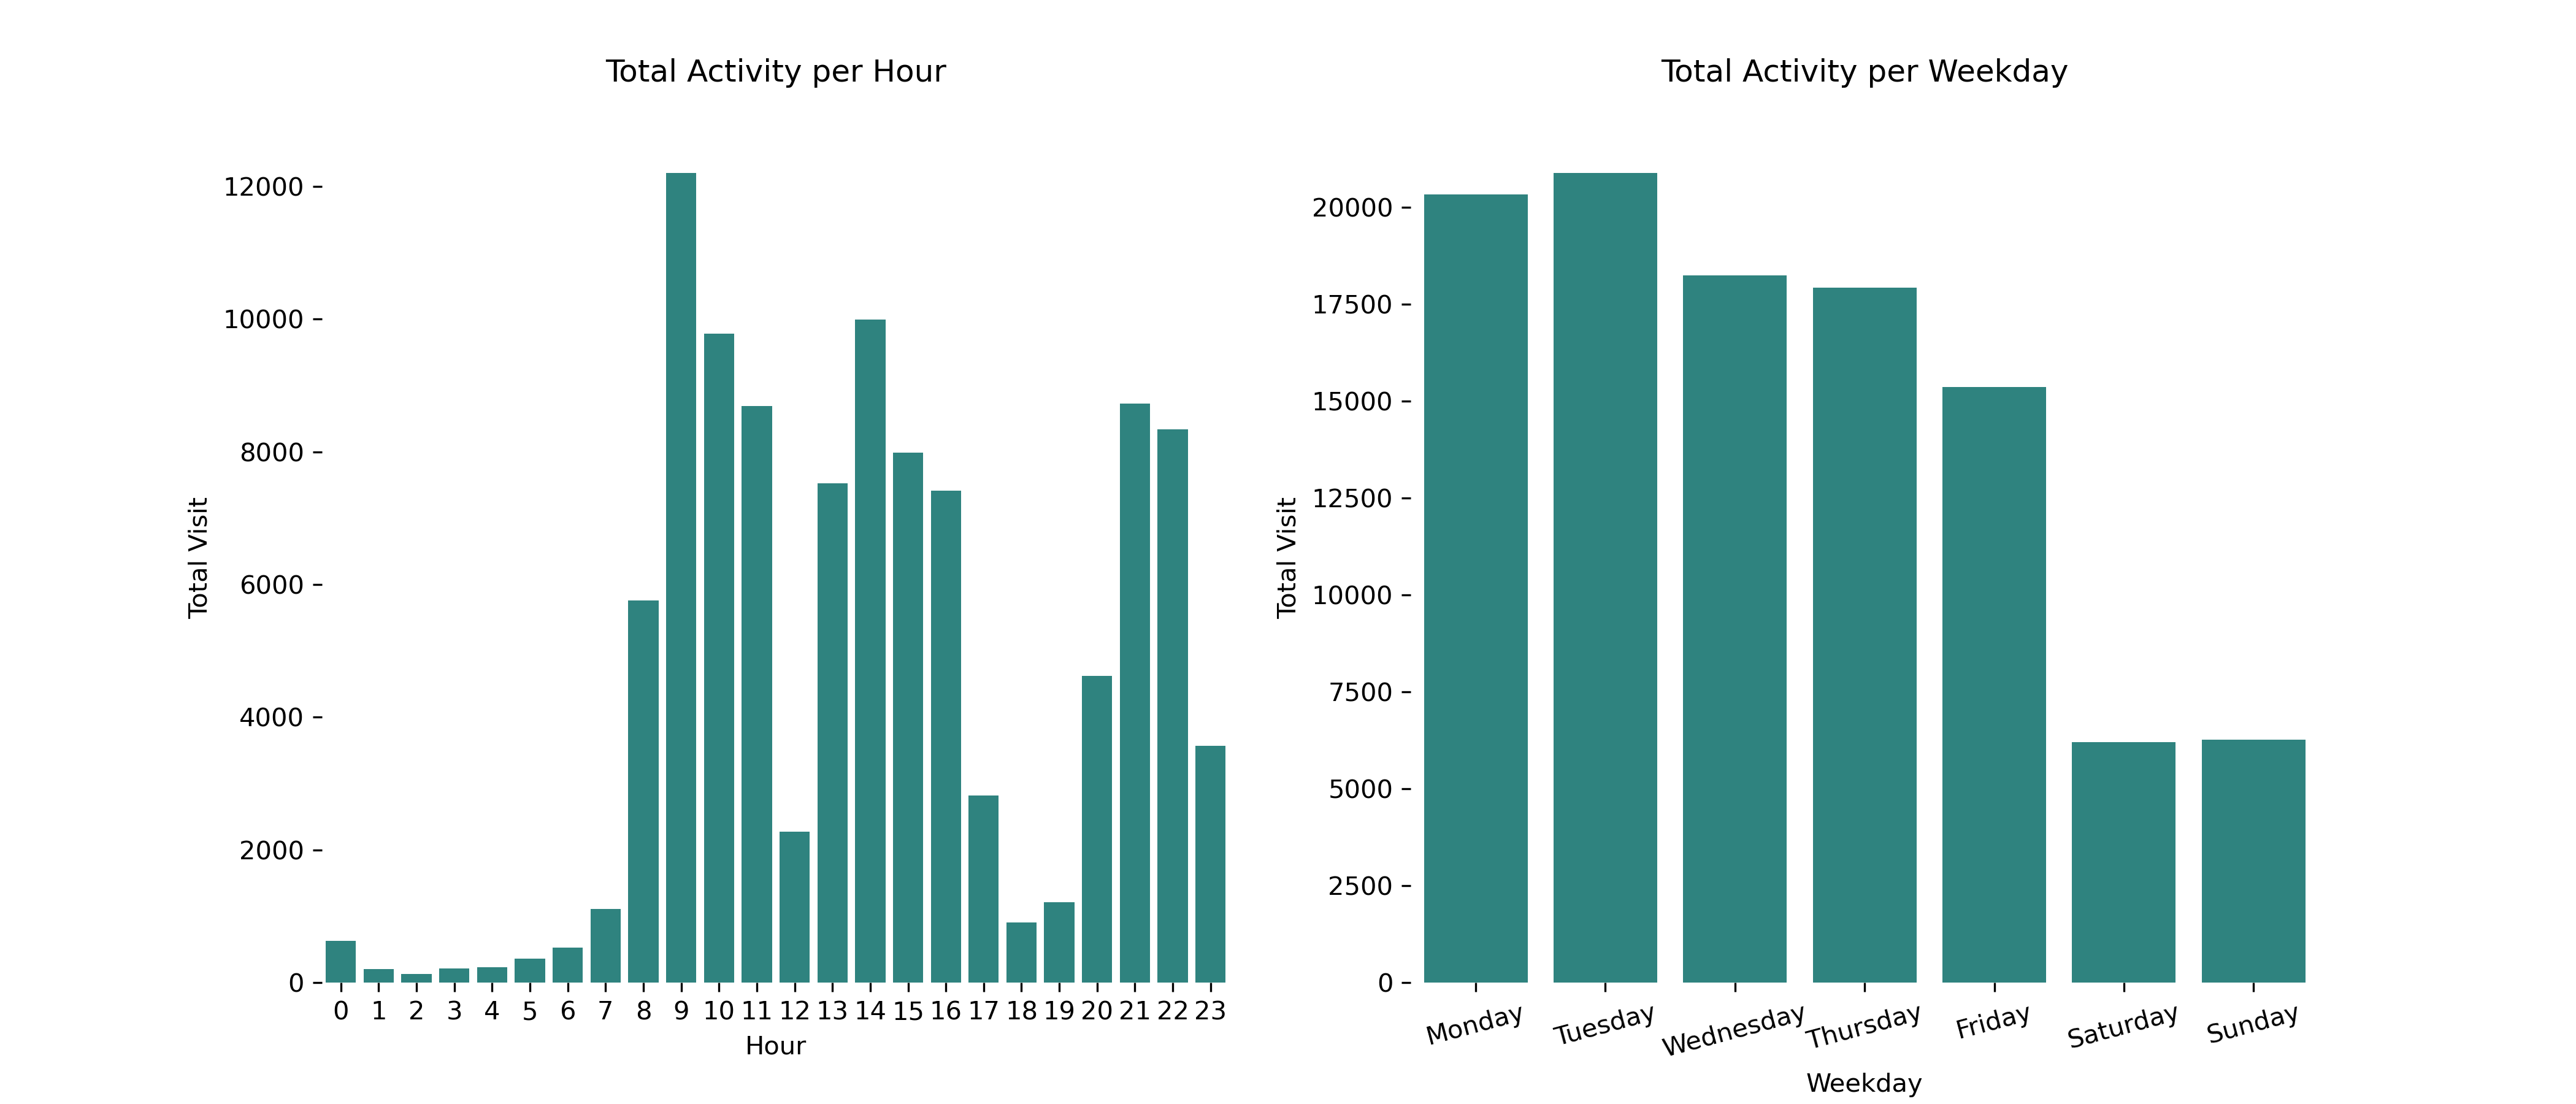 This seems to make sense. From an hourly point of view, I typically work from around 8 AM, take a one-hour break, then continue working until around 5 PM. After some family time, I resume learning around 8 or 9 PM.
If we look at it based on weekdays, it’s safe to assume my activity on workdays is significantly higher compared to my weekends.
Classification
To find out where my time goes, I need to categorize each site as either entertainment, work, or others. Typically, this involves building some kind of vocabulary or using regex (or, if you prefer modeling, some AI/ML algorithm). This will have some inaccuracies, but luckily it’s 2025, and we have LLMs to handle this kind of task in one shot.
The idea is to let an LLM classify the URL for us. I’ve decided to use seven categories:
- Entertainment
- Work
- Personal
- News & Information
- Shopping
- Learning
- Communication
- Unknown
However, any number of categories will be fine. Now, in order to categorize it, we could analyze it based on the URL, its content, or both. But since I want to simplify things, I’ve decided to use just the main domain URL (e.g., Youtube.com, instead of youtube.com/watch?v=dQw4w9WgXcQ). So, first, we need to extract the main domain from all the URLs we have.
import tldextract
def get_clean_url(url: str) -> str:
    ext = tldextract.extract(url)
    return '.'.join([_ for _ in [ext.subdomain, ext.domain, ext.suffix] if _ and _ != 'www'])
Then, since I’m interested in my night activity, I’ll filter the data only for events from 8 PM and above.
df_night = df[df['visit_time_hour'] >= 20]
Next, by using langchain, we could connect to Gemini to classify the main domain URL.
from langchain_google_genai import ChatGoogleGenerativeAI
from dotenv import load_dotenv, find_dotenv
from langchain.schema import HumanMessage, SystemMessage, AIMessage

load_dotenv(find_dotenv())
llm = ChatGoogleGenerativeAI(model='gemini-2.0-flash')

messages = [
    SystemMessage("""
    You are a URL classifier. You are given a URL. Classify the URL into one of the following categories:
    - Entertainment
    - Work
    - Personal
    - News & Information
    - Shopping
    - Learning
    - Communication
    - Unknown
Classify only based on the content, purpose, or common use of the website.
Answer it as JSON, and the input might be a list of URL, joined by some string (like "|").
The output will have keys : "category", and "URL" for the original URL.
Split for each URL, and return in the format 1 JSON per line.

Example:
Input: https://www.netflix.com
Output: {"category": "Entertainment", "URL": "https://www.netflix.com"}
""")
]

q = HumanMessage("""This is the list of URLs you need to detect. The url is seperated by string pipe (|)\n""" + '|'.join(df_night['url_clean'].head(100))
)

result = llm.invoke(messages + [q])
For one-shot prompting (or any other prompt), it’s better to have an example of input and expected output so the result is as expected. To make the process easier, I run it in batches, with 100 URLs per prompt.
This code will generate a class for each URL. We can then group them (based on date, for example) to conduct further analysis. The first visualization I had in mind shows the frequency of my entertainment activities. Using calplot:
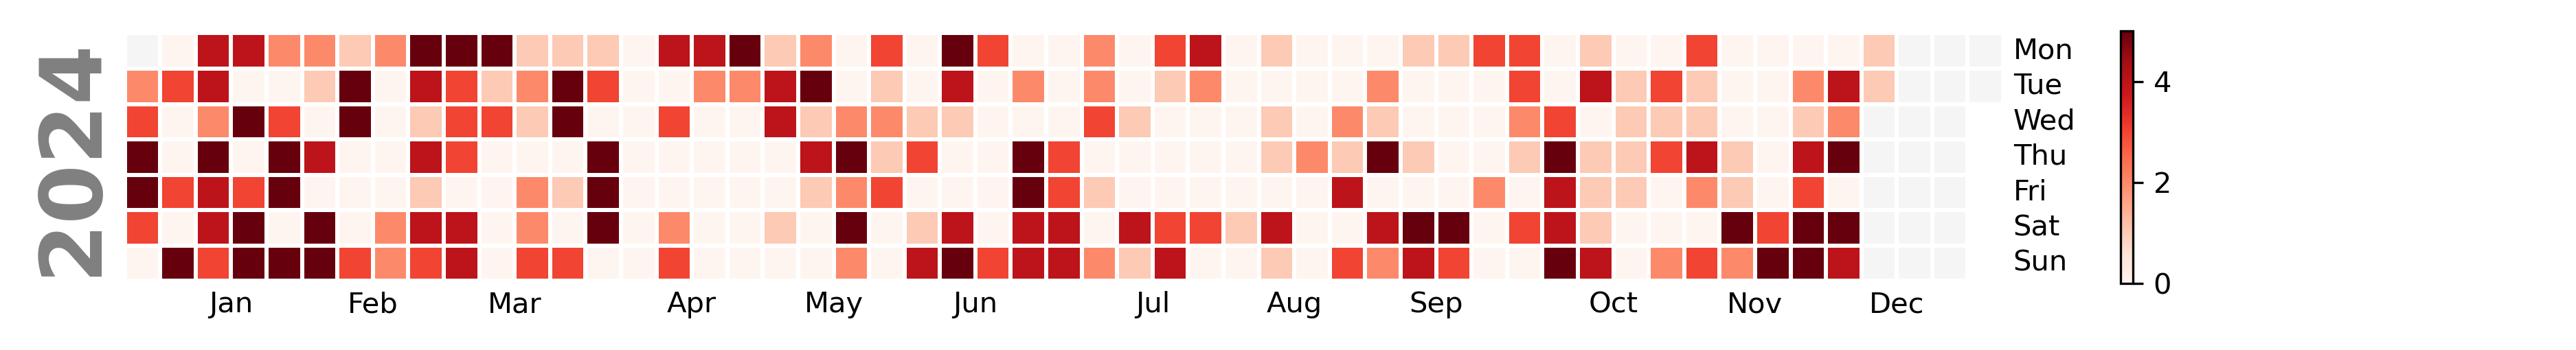
It seems my entertainment peaked in January and around November, with the majority of high-volume entertainment occurring on Sundays. Luckily, the frequency is quite sporadic; no inherent pattern could be found.
Then to find out the average % of my activities:
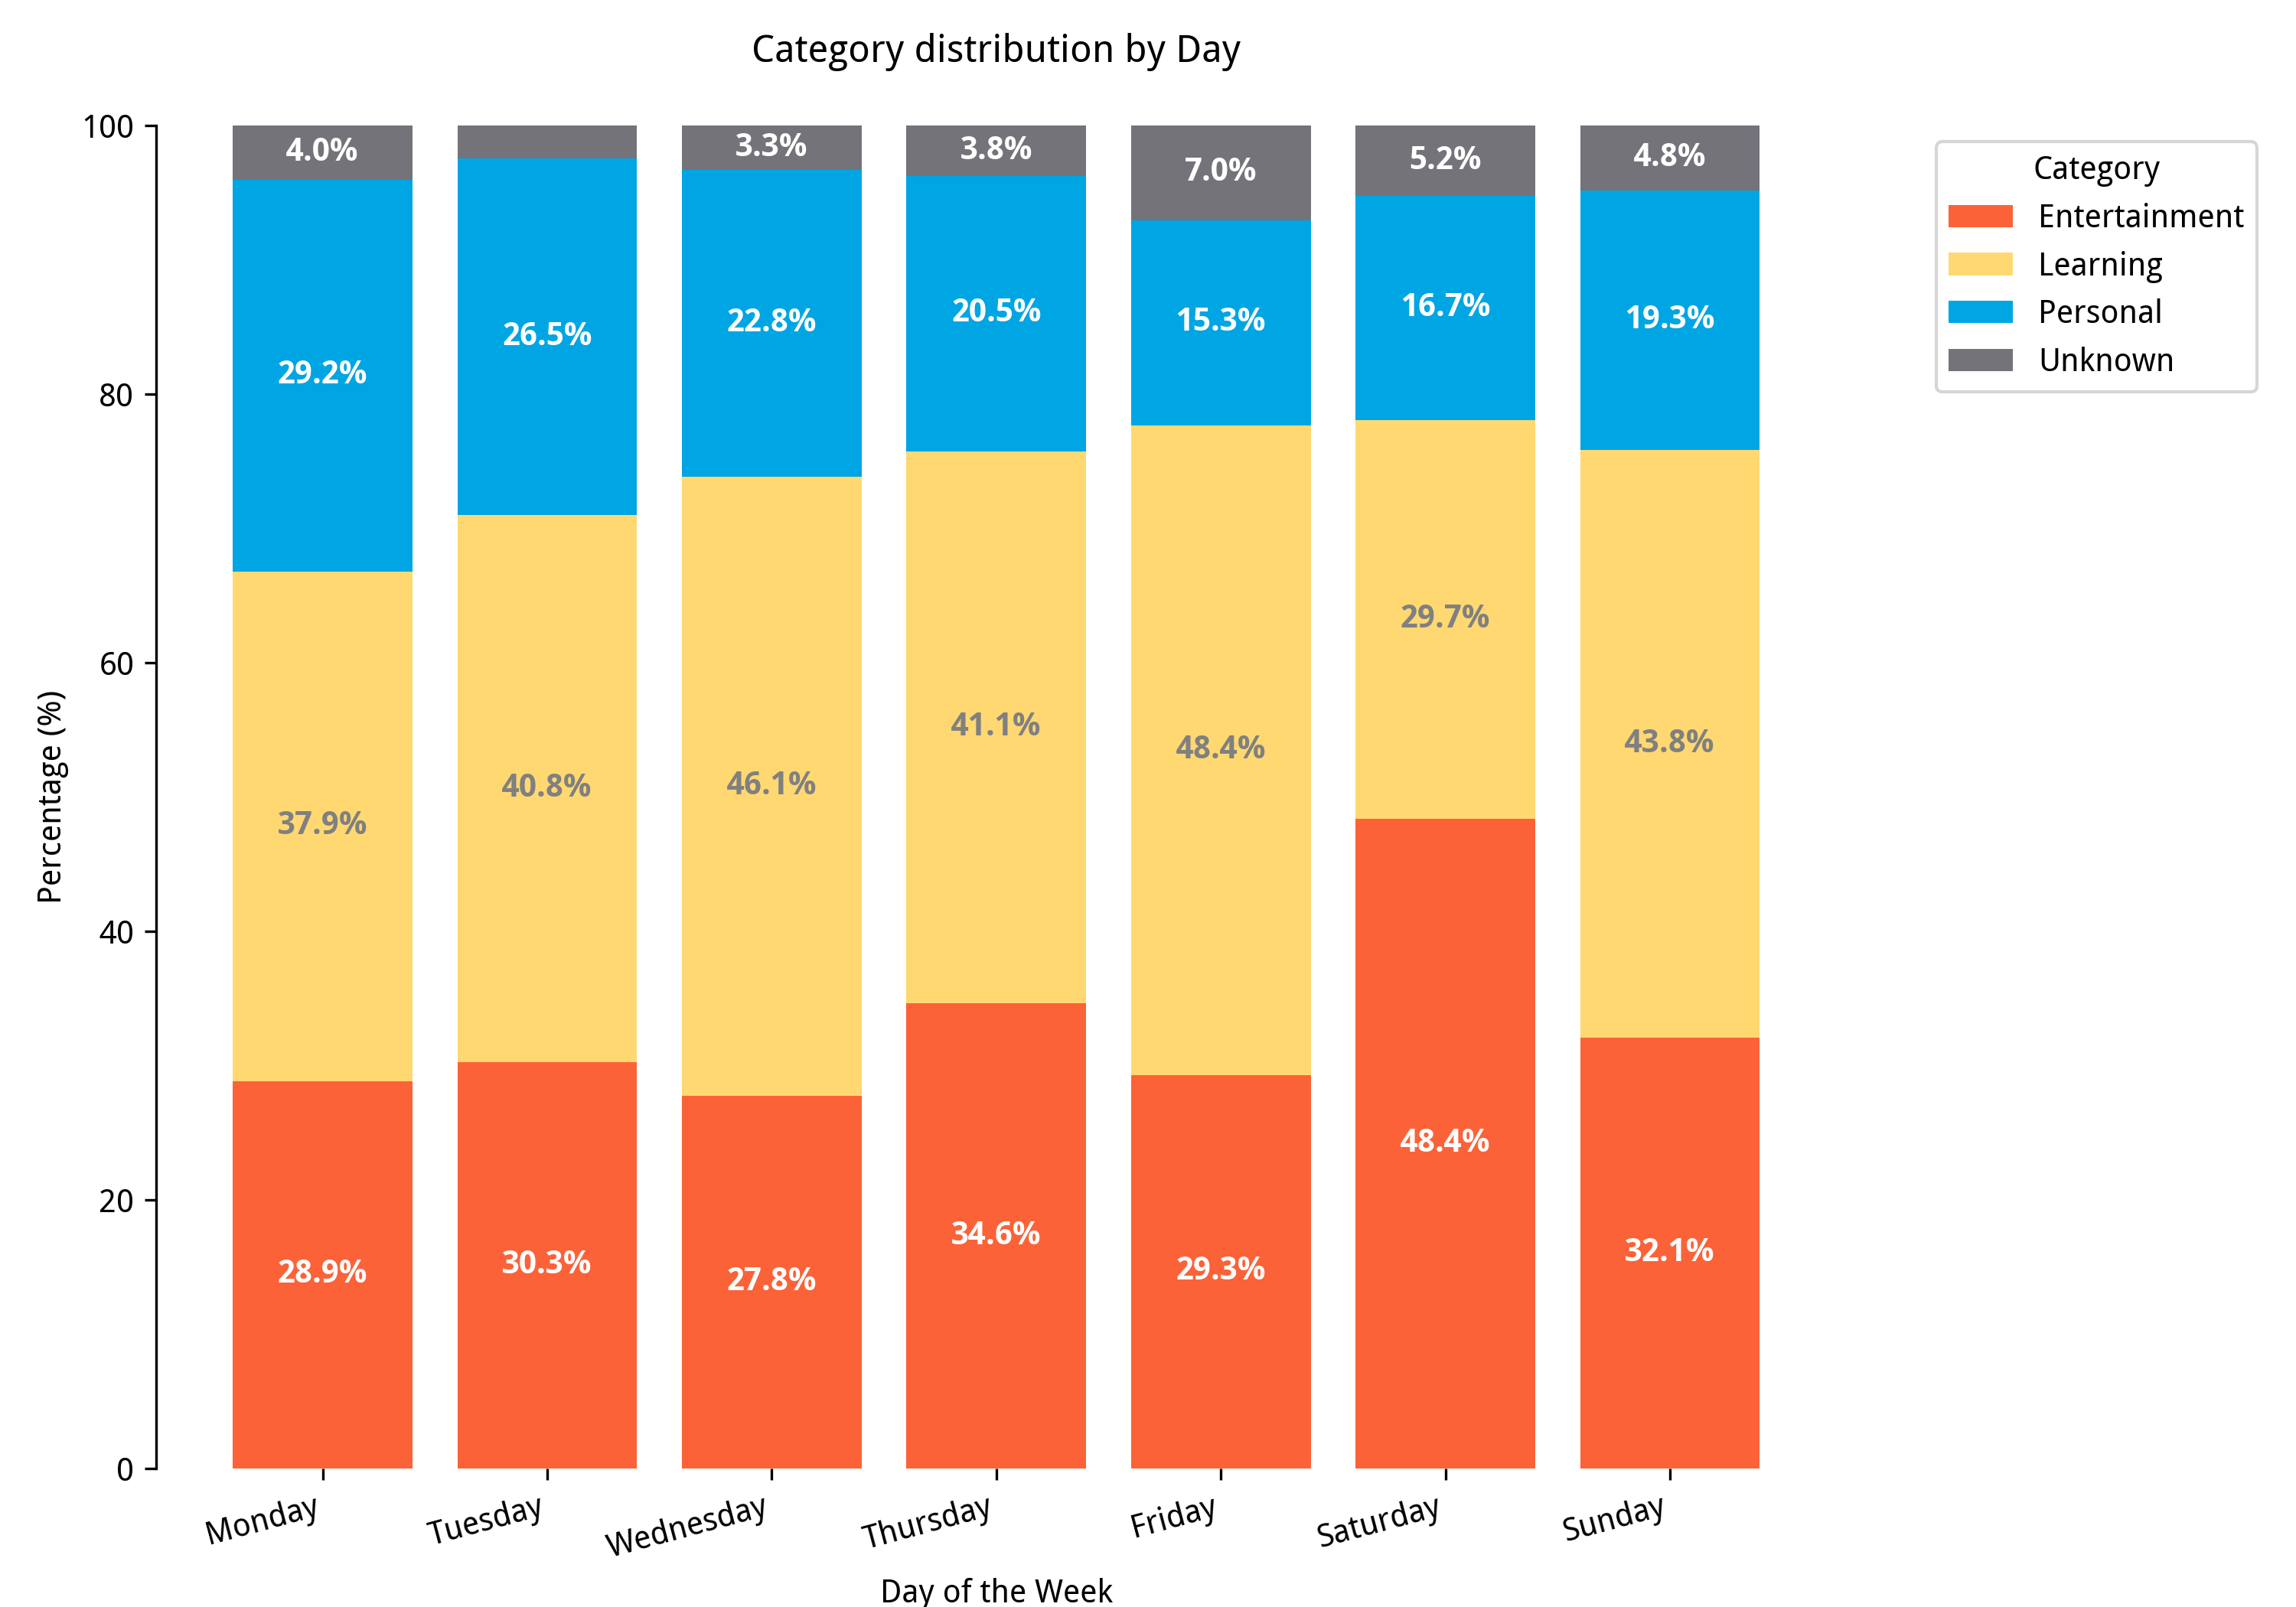
Saturday is when I spend my nighttime doing entertainment. Surprisingly, my Sunday percentage is the same as any other weekday. Maybe it’s because I’m already thinking about work.
Finally, to see what actual site I frequently visit, we could use wordcloud to visualized it.
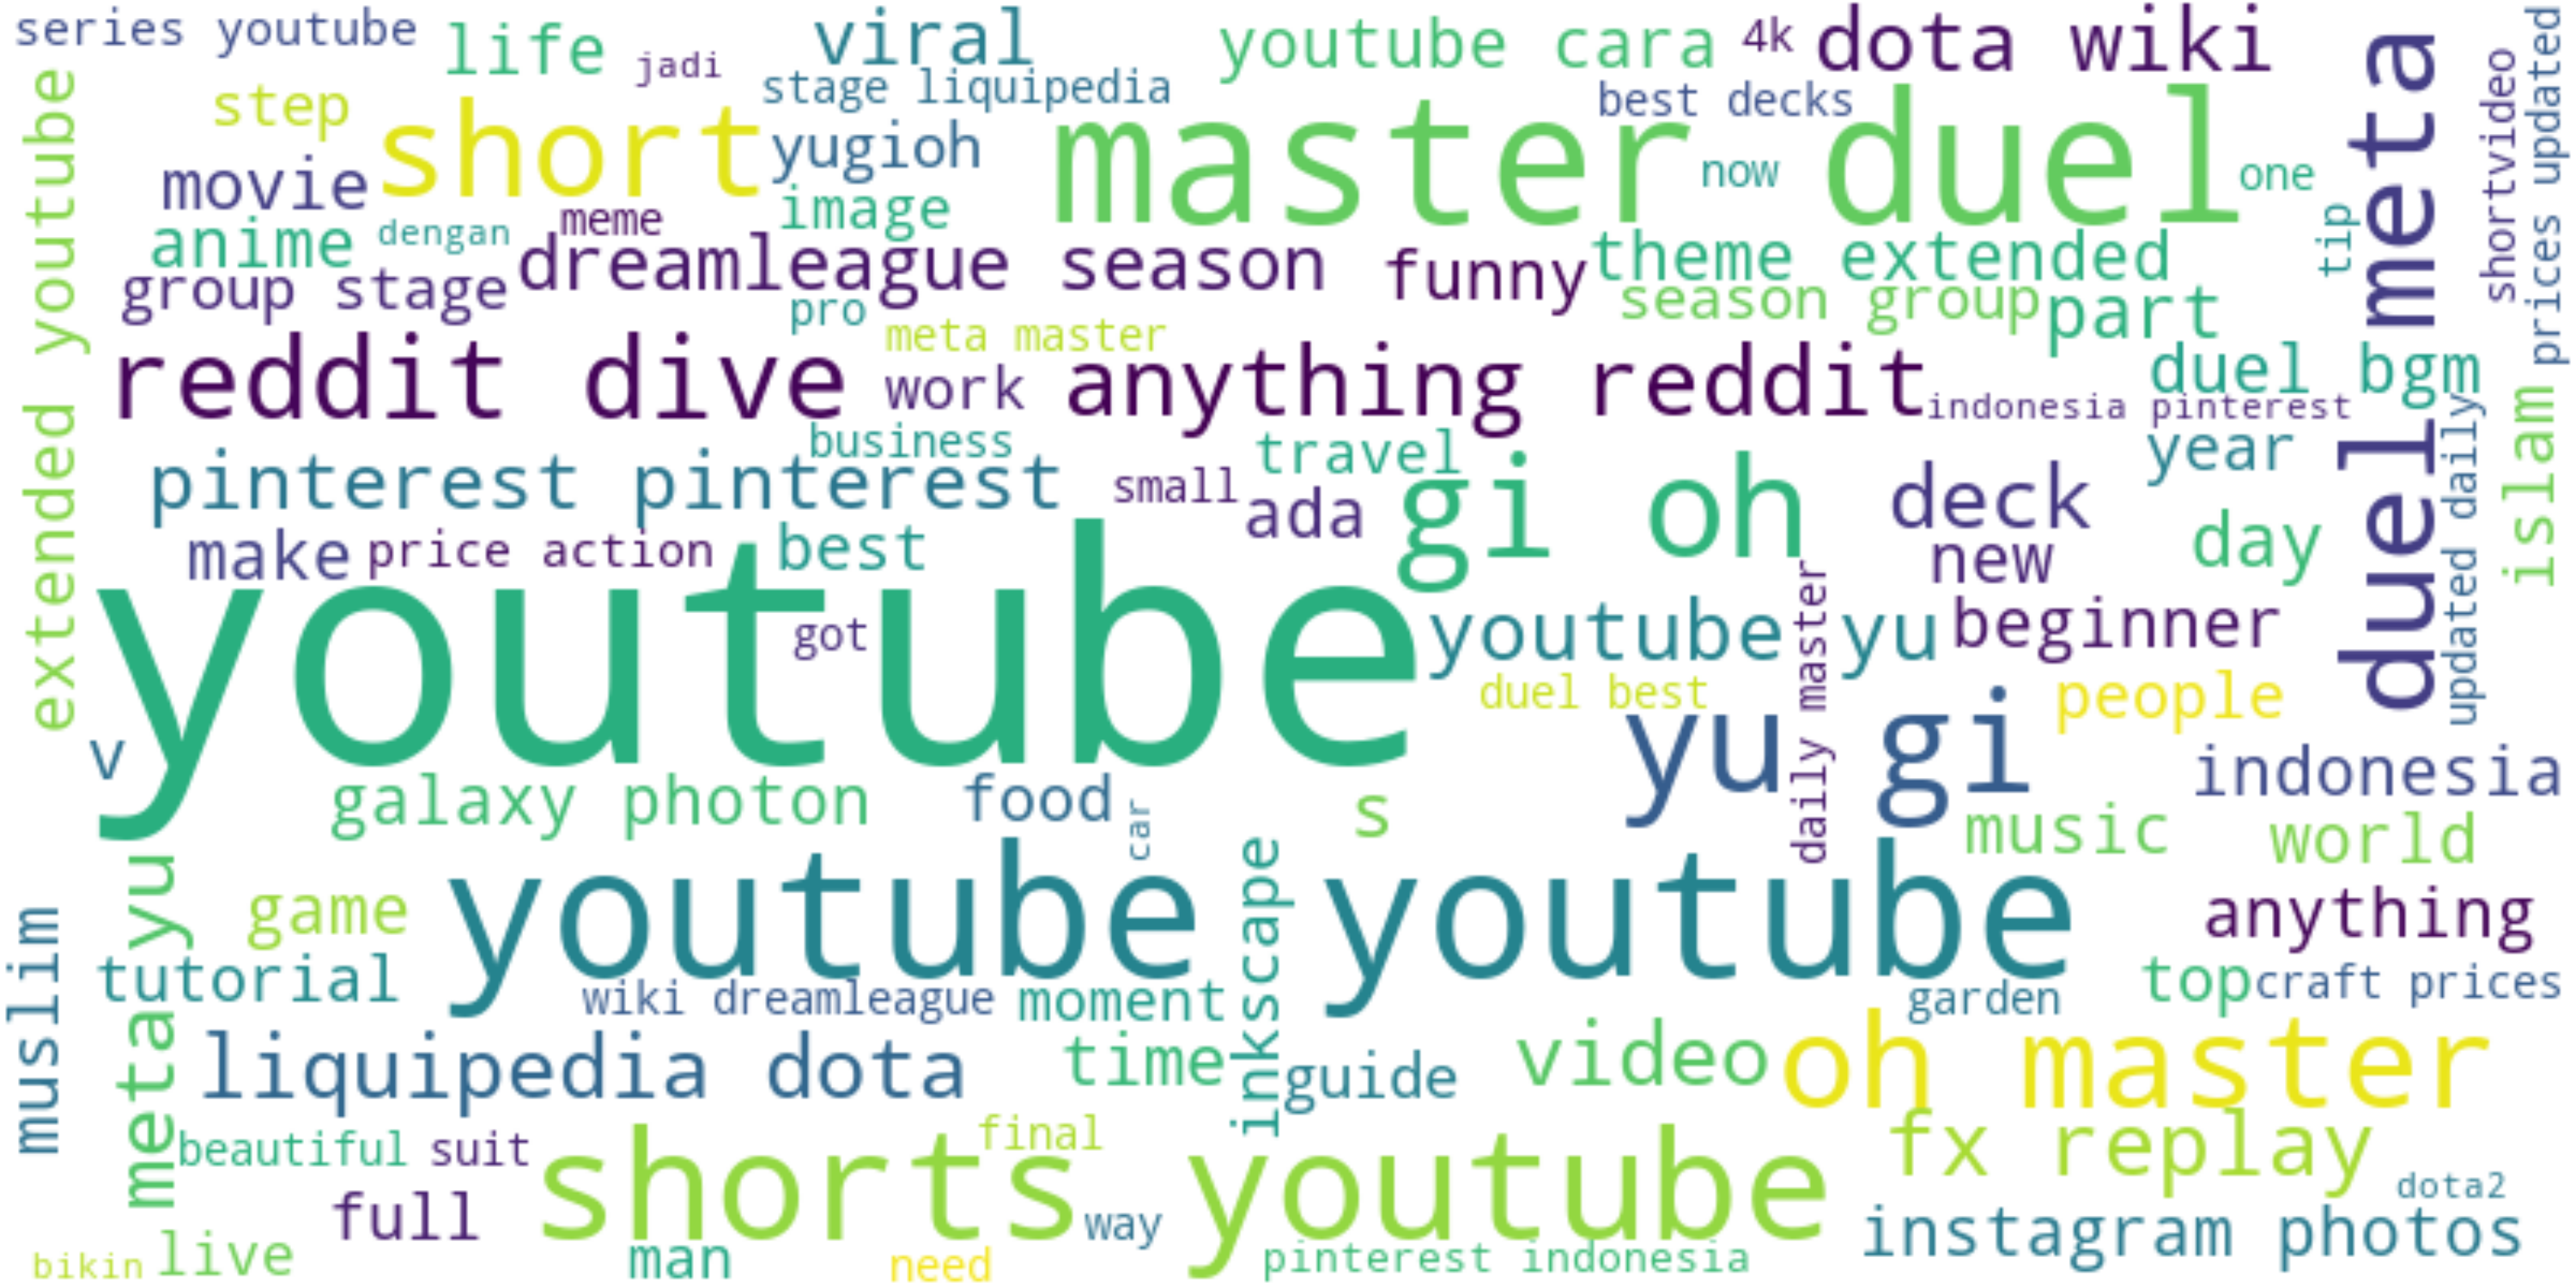
Based on this thing I conclude that there are several things that I spend more time on:
- Social media (Youtube Short, Reddit)
- Card Game (Yu Gi Oh)
- Dota (not playing, just keep up with the game)
Conclusion
Yep, playing card games has become my go-to entertainment recently, but that interest has fortunately faded away. Unfortunately, the “scrolling effect” of YouTube might not disappear anytime soon, so I need to develop a good mechanism to fight back and keep my time for what I intentionally want: learning.
This data only represents unique URL visits and might not reflect the actual amount of time I spend on each site, but it’s still a good start. I’ll probably do more fun analyses like this, using different data, such as from ActivityWatch which I’ve been using for a few months.