The main idea is we need to know whether this distribution is more likely to happen from another distribution with a level of p. So w need three things:
- The first distribution (base) and its parameter
- The second distribution (comparator) and its parameter
- A limit/threshold for which we could safely say this is different.
The Z - Test
The T-test is for small use case ≤ 30, whereas the z-test is for the normal case. Forget about the T-test. The condition for the T-test:
- Population (not sample) standard deviation is not known, AND
- The total sample is less than 30
The assumption for the z-test and t-test is that both samples have the same variance. If not, use the welch test.
The formula for the Z and T-test is actually equal, only in part of standard deviation, where instead of using sample standard deviation (in t), we are using population standard deviation (in Z). However, if our sample is large enough (≥ 30), we could use our sample standard deviation instead in Z. So both are using sample STD, not population STD (even though if you happen to know it you could use it in Z), but in case of the data is small, use T. (Source)
Another part that needs to check is the t and z scores based on the table that would be different.
The formula for Z-test:
$$ Z = \frac{\bar{x} - \mu_{(H_0)}}{s/\sqrt{n}} $$
Z - Test Flow
The flow normally:
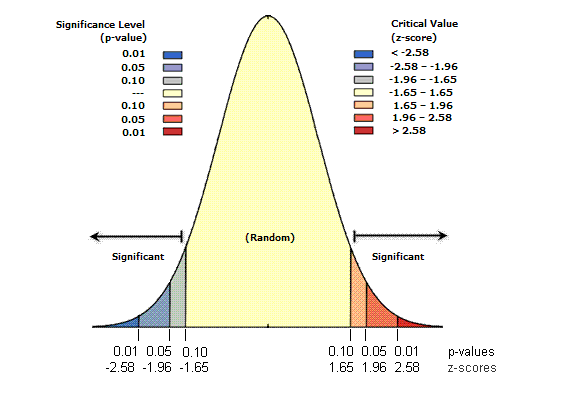
- Check critical value based on our confidence level, and whether it’s two tail or one-tail test
- Calculate Z score based on the equation above
- Compare our Z with critical value, whether it’s in the rejection region or not
Z-Score
Measure how many standard deviations our sample means are from the null hypothesis distribution. Normally would range between -3 to 3 (higher that it is probably different).

Type of Z/T Test
- Comparing sample distribution with population distribution
- Comparing proportion (i.e categorical response ratio) with population proportion.
- Example: comparing the proportion of female STEM students and comparing it with the perceived belief of the population of female STEM
- 2 sample independent test, comparing one sample distribution with other distributions that are independent of each other.
- Example: AB testing between a set of group control versus a set of treatment control
- 2 sample dependent test / paired sample test, comparing one distribution before and after.
- Example: testing whether the student gets a higher score in statistics before and after taking a short class
Z and T distribution
Z and T distribution is actually a form of normal distribution, with Z having 0 mean and 1 variance. T looks like Z but is a bit sensitive to sample size (source).
So there are three approaches for hypothesis testing:
- Traditional/rejection region
- Confidence Interval
- P-Value and significance level
Z Test with Python
Use :
from statsmodels.stats.weightstats import ztest
see: https://www.statsmodels.org/stable/generated/statsmodels.stats.weightstats.ztest.html
One Way ANOVA (Analysis of Variance)
Used to check whether there is a significant difference between three groups/samples. For example, we want to know whether there is a difference in response time between people who drink water, coffee, and lemon juice. We measure the sample, and we could get variance in each group and variance between the group. ANOVA’s main idea is to measure it. If the between-group variance is small then it’s not affected, and vice versa.

P-Value
Definition: the probability of observing more extreme data than your sample.
- Let’s say you have your population ($H_0$) mean, and you have your sample mean.
- Get the z-score from your sample mean (also called critical value).
- What is the probability from your population, that we get the more extreme data from your z-score?
- To get the p-value, you look into the table.
Source: https://www.youtube.com/watch?v=KLnGOL_AUgA
Resource:
- Intro chi-square vs t-test: https://home.csulb.edu/~msaintg/ppa696/696stsig.htm
- basic significance test: http://www.stat.yale.edu/Courses/1997-98/101/sigtest.htm